If you have ever searched for the average 401(k) balance by age, you have probably noticed that different websites quote different numbers. That is because there is no single official national average. The most useful figures come from major retirement plan providers such as Fidelity and Vanguard, each reporting on millions of real retirement accounts.
Knowing the “average” 401(k) balance for your age can be useful—but only if you understand what the number does and does not tell you.
The latest large-scale reports from Fidelity and Vanguard show a wide gap between typical and average account balances. They also show that age is only one part of the picture. Income, job tenure, employer contributions, market returns, plan design, and whether someone has rolled money into an IRA can all materially change the number shown in a workplace plan.
This guide uses only first-party data published by Fidelity and Vanguard. It does not combine the figures into a made-up national average because the two firms measure different populations at different dates.
Key takeaway: A 401(k) comparison is a reference point, not a retirement-readiness score. Your projected spending, savings rate, time horizon, other accounts, and expected retirement income matter more than whether your balance is above or below one average.
Average 401(k) balance by generation in 2026
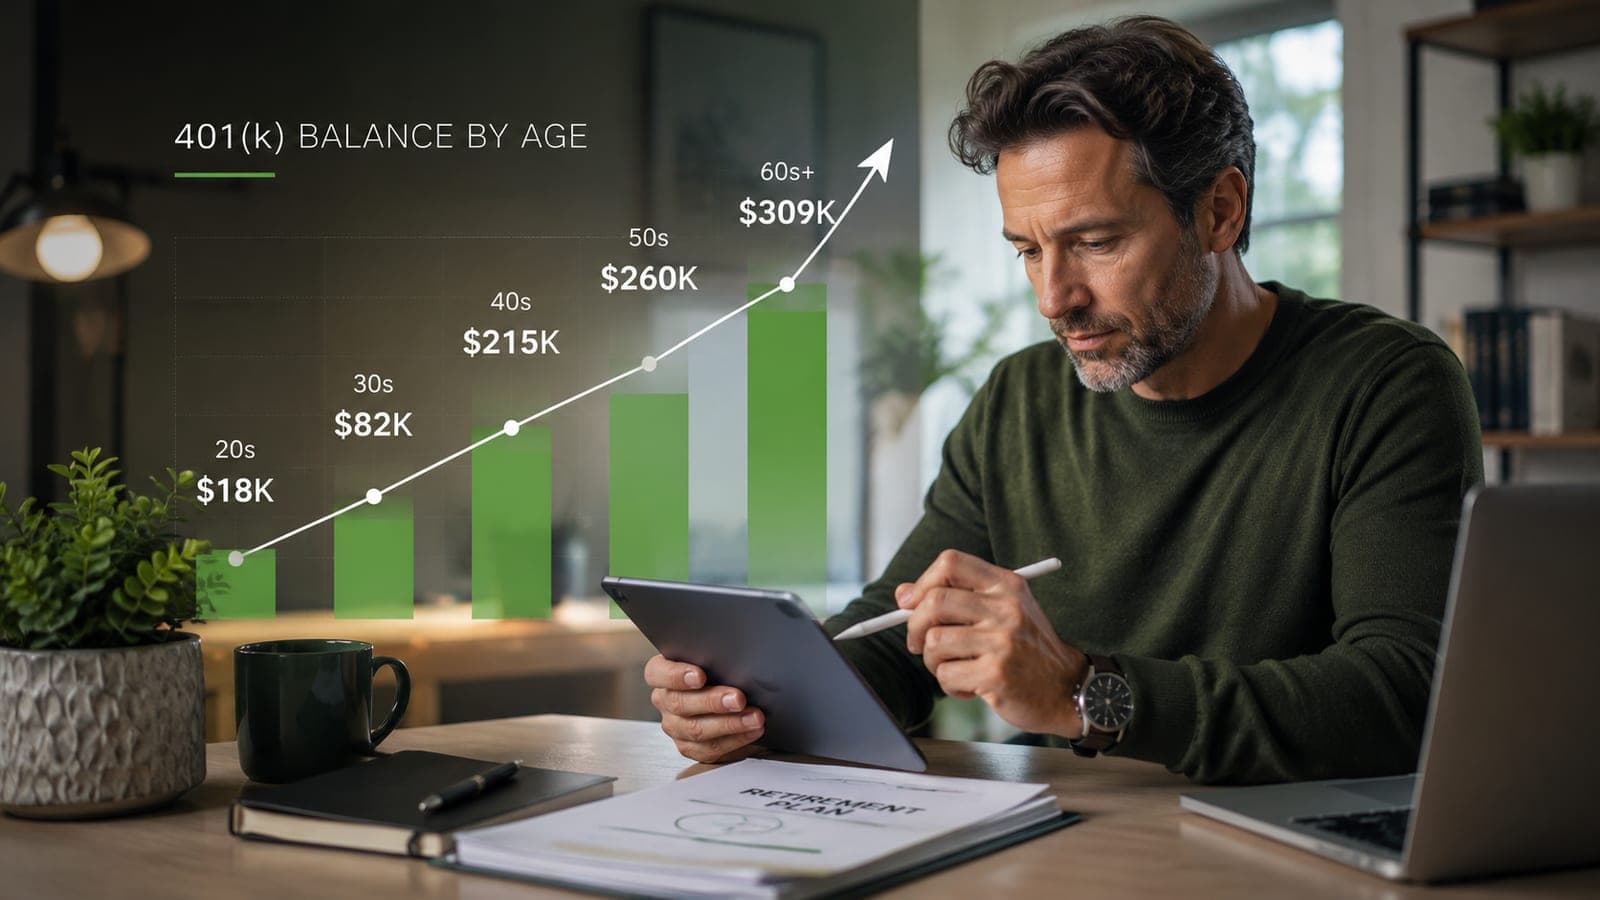
Fidelity's Q1 2026 report covers 26,800 corporate defined contribution plans and 25.6 million participants as of March 31, 2026. It reported the following average 401(k) balances:
| Generation | Birth years used by Fidelity | Approximate age in 2026 | Average 401(k) balance |
|---|---|---|---|
| Gen Z | 1997-2012 | About 14-29 | $18,000 |
| Millennials | 1981-1996 | About 30-45 | $82,600 |
| Gen X | 1965-1980 | About 46-61 | $215,600 |
| Baby Boomers | 1946-1964 | About 62-80 | $260,300 |
| Overall | — | — | $141,000 |
The age ranges are approximate because a person's exact age depends on their birthday. The generation definitions are the Pew Research ranges used in Fidelity's report.
These numbers should not be interpreted as targets. Older workers have generally had more years to contribute and more time for investment growth. Younger workers also tend to have shorter job tenure and lower earnings, and many Gen Z adults are not yet full-time workers or 401(k) participants.
What Vanguard's 2026 report adds
Vanguard's How America Saves 2026 analyzes 4.6 million participant accounts across approximately 1,300 defined contribution plans. For year-end 2025, Vanguard reported:
Average account balance: $167,970
Median account balance: $44,115
That difference is the most important statistic in this article.
The average was almost four times the median. A relatively small group of very large accounts pulls the average upward, while the median represents the midpoint: half of accounts were above it and half were below it.
This is why “the average person has $167,970” would be a misleading way to present the Vanguard result. The report describes account balances in Vanguard-administered plans—not the total retirement wealth of every American household.
Average versus median: which number should you use?
For personal comparison, the median is often more useful than the average.
Imagine five balances:
- $10,000
- $20,000
- $30,000
- $40,000
- $500,000
The average is $120,000, but four of the five people have less than that. The median is $30,000, which better describes the center of the group.
The same effect appears in retirement-plan data. High earners, long-tenured employees, older participants, and people who have not rolled assets out of their employer plan can have much larger balances than the typical participant.
Use the average to understand the scale of assets in the system. Use the median to understand what a more typical account looks like. Use neither as a substitute for an individual retirement projection.

Why Fidelity and Vanguard report different averages
Fidelity reported an overall average 401(k) balance of $141,000 for Q1 2026. Vanguard reported an average defined contribution account balance of $167,970 at year-end 2025.
Neither figure is necessarily wrong. They come from different datasets.
Key differences include:
- Different recordkeepers and plan populations. Each company measures the plans and participants on its own platform.
- Different measurement dates. Vanguard's figure is for year-end 2025; Fidelity's is for March 31, 2026.
- Different plan and participant composition. Industries, salaries, tenure, employer contributions, and plan rules vary.
- Market movement. Account values change with contributions, withdrawals, and investment returns.
- Account movement. A former employee may leave money in a plan, roll it into an IRA, or move it to a new employer plan.
For those reasons, it would be poor methodology to average the Vanguard and Fidelity figures together and label the result “the true 2026 average.”
What changed in early 2026?
Fidelity reported that its average 401(k) balance rose 11% from Q1 2025 to Q1 2026, even though the balance declined from $146,400 in Q4 2025 to $141,000 in Q1 2026.
The same report found that:
- The average employee 401(k) savings rate reached 9.6%.
- The total 401(k) savings rate, including employer contributions, reached 14.4%.
- 18% of participants increased their contribution rate during Q1 2026.
- 18.8% contributed to a Roth 401(k), an all-time high in Fidelity's dataset.
- 19.2% had an outstanding 401(k) loan.
These figures show why a balance alone can be a noisy measure. A saver may be making strong progress even during a quarter when market values decline.
Savings behavior by generation
Fidelity's Q1 2026 data also shows how contribution behavior changes across generations.
| Generation | Employee savings rate | Employer contribution rate | Total of these two rates |
|---|---|---|---|
| Gen Z | 7.5% | 4.0% | 11.5% |
| Millennials | 9.0% | 4.8% | 13.8% |
| Gen X | 10.5% | 5.2% | 15.7% |
| Baby Boomers | 12.2% | 5.1% | 17.3% |
| Overall | 9.6% | 4.8% | 14.4% |
The final column is simple addition for context, and it matches Fidelity's reported overall total savings rate. It should not be treated as a recommendation for every worker.
Older participants save at higher rates on average, but they are also closer to retirement and may have higher incomes. Younger workers often face competing priorities such as housing, student debt, childcare, and emergency savings.
Is your 401(k) balance “good” for your age?
A useful answer requires more than a peer comparison.
Consider these five questions:
- How much do you expect to spend in retirement?
A person planning to spend $40,000 per year needs a different portfolio than someone planning to spend $100,000. - What other retirement income will you have?
Social Security, pensions, rental income, taxable investments, IRAs, and a spouse's assets may all contribute. - How many years remain until retirement?
Time can be more important than today's balance because future contributions and compounding may account for a large share of the final portfolio. - What percentage of income are you saving?
A lower balance paired with a rising savings rate may be more encouraging than a higher balance paired with no current contributions. - Is all your retirement money in this 401(k)?
People frequently have more than one retirement account. A current employer's 401(k) may show only part of the picture.
Use the RetireToday retirement calculator to estimate your retirement timeline using your current savings, income, annual spending, and age.
A practical way to use these benchmarks
Use the data as a diagnostic, not a verdict.
- Below the median: Review whether you are receiving the full employer match, whether contribution increases are affordable, and whether old accounts have been overlooked.
- Between the median and average: You may be ahead of many participants, but your spending goal and retirement date still determine whether you are on track.
- Above the average: A high balance is encouraging, but taxes, asset allocation, retirement duration, and planned spending still matter.
The most actionable number is often not your balance. It is the gap between your current savings rate and the rate required by your own plan. For a broader benchmark, compare your progress with practical retirement savings by age targets.
Important limitations of 401(k) balance data
The figures in this article do not represent every American.
They exclude or underrepresent people who:
- do not have access to a workplace retirement plan;
- are eligible but do not participate;
- hold retirement savings mainly in an IRA;
- have multiple accounts at different providers;
- have rolled old 401(k) assets elsewhere;
- are self-employed;
- participate in a pension or another type of plan.
The reports also measure accounts or participants on specific platforms. They are high-quality datasets, but they are not a census of total household retirement wealth.
Bottom line
The latest official provider data shows that average 401(k) balances rise sharply with age, from $18,000 for Gen Z participants to $260,300 for Baby Boomers in Fidelity's Q1 2026 dataset.
But the Vanguard data supplies an essential warning: its $167,970 average balance sits far above its $44,115 median. That gap means the average is not typical.
The right question is not simply, “Am I above average?” It is:
Given my age, current savings, future contributions, expected spending, and other retirement income, am I on track for the retirement I want?
That is a planning question—not a ranking question.
Frequently asked questions
What is the average 401(k) balance in 2026?
Fidelity reported an average 401(k) balance of $141,000 as of March 31, 2026. Vanguard reported an average defined contribution account balance of $167,970 at year-end 2025 in its 2026 report. The figures differ because the companies measure different participant populations at different dates.
What is the median 401(k) balance in 2026?
Vanguard reported a $44,115 median account balance for year-end 2025. Fidelity's Q1 2026 report cited in this article provides average balances by generation but does not provide a directly comparable median by generation in the referenced table.
How much does the average 40-year-old have in a 401(k)?
The official reports used here do not publish a single balance specifically for age 40. Fidelity reports an average of $82,600 for Millennials, defined as people born from 1981 through 1996. In 2026, a 40-year-old generally falls within that cohort. This is a broad comparison, not a personal target.
Why is the median so much lower than the average?
Large accounts pull the arithmetic average upward. The median is the midpoint of the distribution and is therefore less affected by a relatively small number of very high balances.
Does a 401(k) balance include Social Security or an IRA?
No. A 401(k) balance measures assets in that workplace account. It does not include Social Security benefits, IRAs, taxable investments, pensions, real estate, or other employer plans.
Is a higher 401(k) balance always better?
A higher balance generally provides more retirement flexibility, but retirement readiness also depends on spending, taxes, investment risk, time horizon, health costs, other income, and expected longevity.
Sources
- Fidelity Investments, Q1 2026: Building Financial Futures. Data based on 26,800 corporate defined contribution plans and 25.6 million participants as of March 31, 2026.
- Vanguard, How America Saves 2026, 25th edition. Vanguard recordkeeping statistics include 4.6 million participant accounts and approximately 1,300 plans for 2025.
Editorial note
This article is educational and does not provide individualized investment, tax, or legal advice. Figures are reproduced or calculated from the cited first-party reports. Provider datasets differ and should not be combined as though they describe the same population.